With the estimated feedlot turnover rate, the current supply of feeder cattle is not sufficient to maintain the current feedlot inventory.
Derrell S. Peel, Oklahoma State University
The latest USDA Cattle on Feed report showed feedlot inventories at 11.505 million head on February 1, down 1.8 percent year over year and the fifteenth consecutive month of declining feed inventories. January placements were down 4.7 percent year over year while January marketings were down 13.0 percent compared to last year. January marketings were likely hampered by the winter storm at the end of the month, pushing some January marketing into February. The report was well anticipated and did not contain any surprises for the market.
The February Cattle on Feed report also contains a summary of 2025 and a look at the structure of the cattle feeding industry. A total of 26,082 feedlots are reported in the country with 24,000 of those with less than 1,000 head capacity. Those small feedlots, amounting to 92 percent of all feedlots, only accounted for 12.9 percent of total feedlot marketings last year. Average marketings from those small feedlots was less than 126 head for the year.
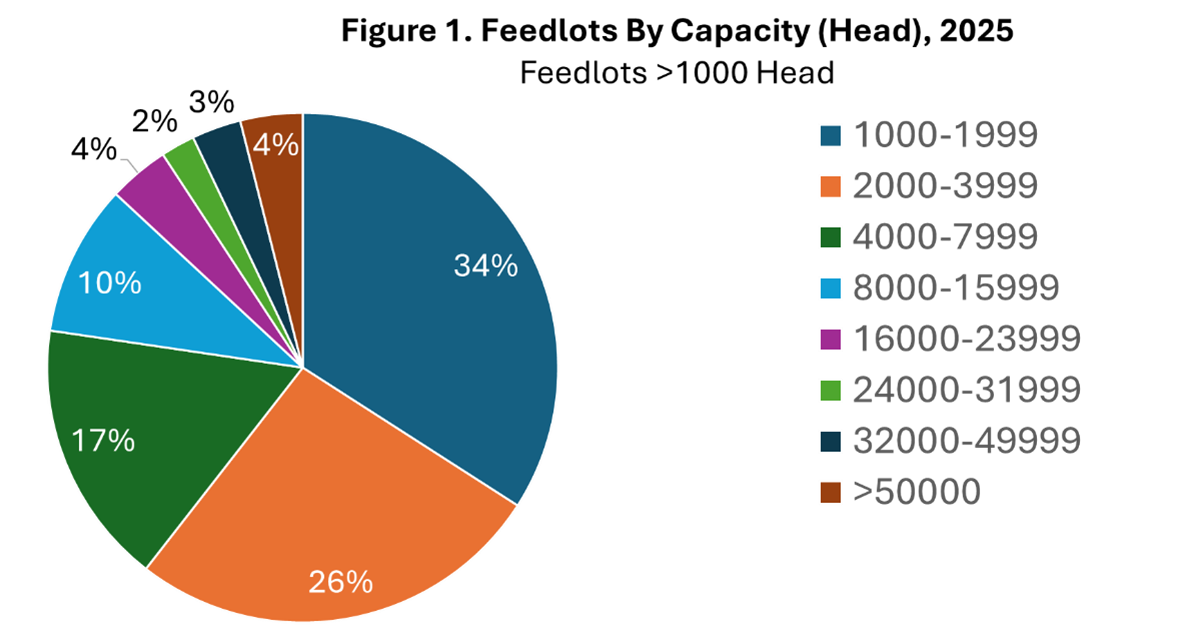
A total of 2082 feedlots with more than 1,000 head capacity (included in monthly COF reports) accounted for 87.1 percent of the 23.483 million head of feedlot marketings. Figure 1 shows the size distribution of feedlots with >1,000 head capacity. Figure 1 above shows that 60 percent of >1,000 head feedlots have between 1,000 and 4,000 head of capacity. However, Figure 2 below shows that these feedlots only account for about nine percent of marketings.
The largest feedlots included four percent with capacity greater than 50,000 head and three percent with capacity between 32,000 and 50,000 head. However, the largest feedlots account for 41 percent of fed cattle marketed along with another 18 percent for the second largest category (Figure 2 below). Thus, 7.1 percent of the largest feedlots marketed 58.8 percent of fed cattle in 2025. For feedlots >50,000 head capacity, 82 feedlots marketed 8.39 million head, or average marketings per feedlot of 102,317 head in 2025.

USDA also estimates total feedlot capacity in the country at 17.1 million head, down fractionally year over year. Feedlot capacity has averaged 17.07 million head for the past twenty years, ranging from 16.7 million head in 2009 to 17.3 million head in 2017. Total feedlot capacity has varied between 17.1 and 17.2 million head since 2018. The total feedlot inventory on January 1 was 81 percent of total feedlot capacity; with feedlots of >1,000 head capacity utilizing 67 percent of total feedlot capacity.
Figure 3 below shows that the cattle feeding industry has grown relative to the overall size of the cattle industry. As 2026 begins, 16.1 percent of all the cattle in the country were in feedlots, down slightly from the peak in 2024 and 2025. The January 1 feedlot inventory was 56.5 percent of the estimated feeder supply of 24.5 million head, implying that there are 1.77 head of feeder cattle available to enter feedlots relative to the current feedlot inventory. With an estimated feedlot turnover rate of 1.99, the current supply of feeder cattle is not sufficient to maintain the current feedlot inventory.

The Extension Experience Podcast is back for a new season starting with a great Cattle Market Outlook with Dr. Derrell Peel. Click the link below for direct access to the audio on Apple Podcasts or subscribe to the show to never miss an episode! Scary Good Beef Prices with Dr. Derrell Peel