Feedlot inventories are expected to decrease seasonally for another three months or so.
Derrell S. Peel, Oklahoma State University
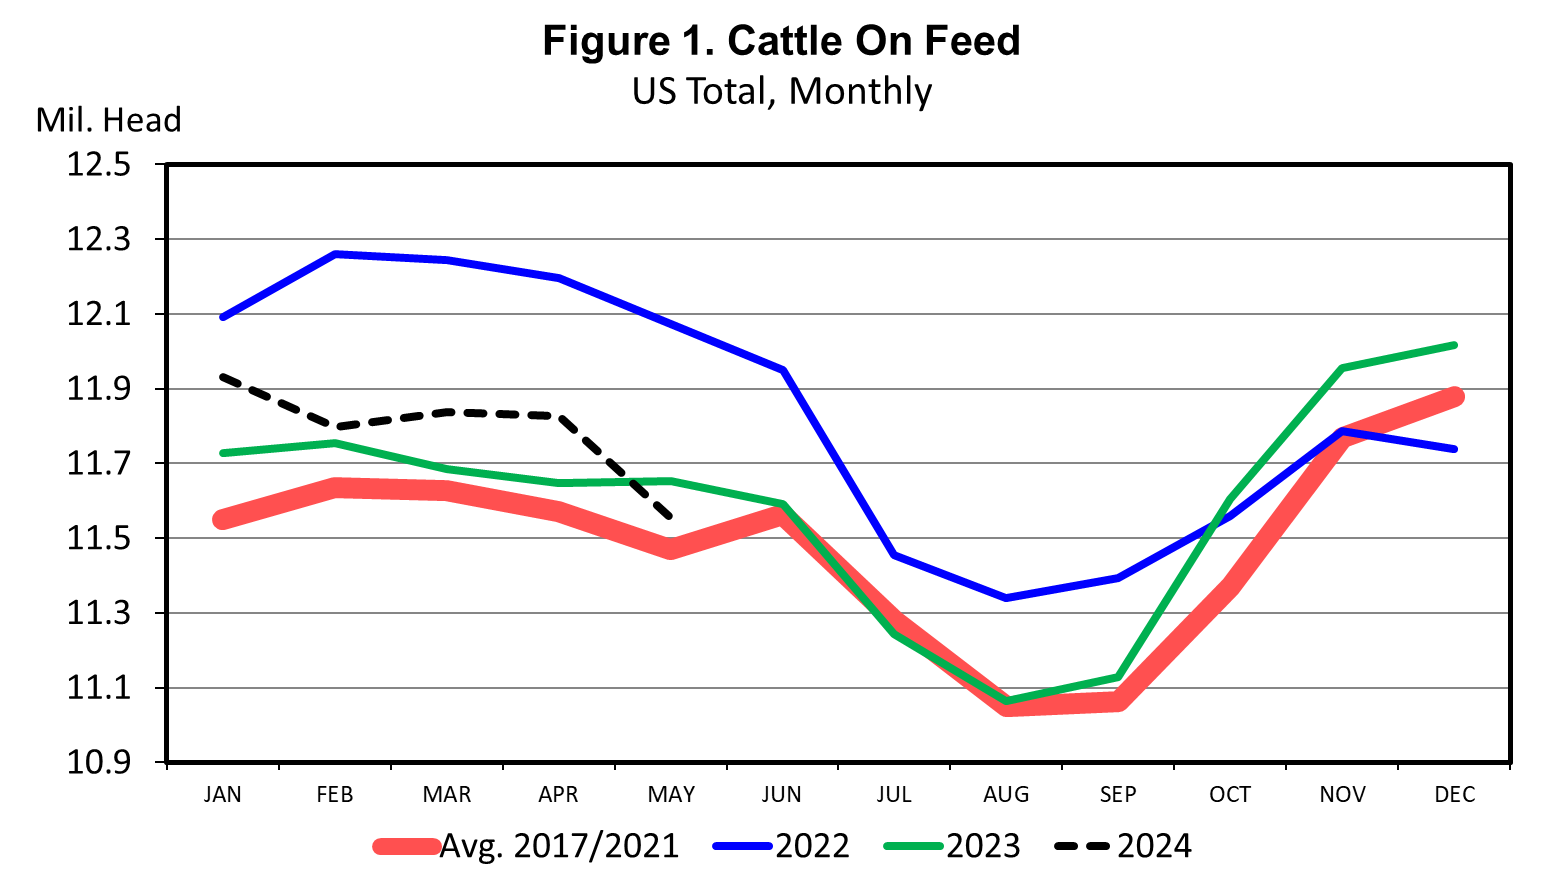
The latest USDA Cattle on Feed report pegged May 1 feedlot inventories at 11.554 million head, down 0.9 percent from one year ago. This is the first year over year decrease in feedlot inventories in eight months. Feedlots typically see a consistent seasonal pattern in inventories with peaks in the November to February period and summer lows in July-September. The average seasonal decrease from peak to trough has averaged just under 900,000 head in the past five years. The May 1 inventory is down 462,000 head from the recent December 2023 peak. Feedlot inventories are expected to decrease seasonally for another three months or so, but the more important question may be the extent to which feedlot inventories will increase for the next seasonal peak.
The top four cattle feeding states all have May 1 inventories lower year over year. Texas has the largest inventory at 2.77 million head, down 0.7 percent from last year. Nebraska is number two with an inventory of 2.51 million, down 1.2 percent year over year. Kansas is the third largest cattle feeding state with a May 1 inventory of 2.30 million head, down 5.7 percent from one year ago. Colorado is number four with 0.950 million head, down 3.1 percent year over year. The top four feedlot states represent 73.8 percent of total inventories in feedlots with 1000 head or more of capacity. Other cattle feeding states, in descending order, include Iowa, California, Idaho, Oklahoma, Arizona, South Dakota, and Washington.
April feedlot placements were 1.656 million head, down 5.8 percent year over year and the smallest April placement total since the pandemic reductions in April 2020. In the first four months of 2024, total placements are down 4.3 percent year over year, with placements of cattle weighing less than 800 pounds down 6.7 percent. Placements of cattle weighing 800 pounds and higher are unchanged from one year ago.
April feedlot marketings were 1.872 million head, up 10.1 percent year over year. April 2024 had two more business days compared to last year. After adjusting for the number of days, daily average marketings in April were about equal to April 2023. April marketings were 15.8 percent of the April 1 on-feed inventory, the highest monthly rate since August 2023. Nevertheless, the average marketing rate over the past twelve months remains historically low. Marketings in the first four months of this year are down 0.6 percent year over year.
The slow pace of feedlot marketings continues to push fed cattle weights higher. The latest weekly data shows steer carcass weights at 923 pounds, up 32 pounds compared to one year ago, and heifer carcass weights of 848 pounds, up 28 pounds from one year ago. Increased carcass weights are partially offsetting reduced cattle slaughter and keeping beef production higher than otherwise. For the first 19 weeks of the year, beef production is down 2.1 percent year over year. Earlier forecasts called for 2024 beef production to be down nearly five percent, but those forecasts have been revised due to the heavy carcass weights to a smaller year over year decrease in beef production.


