Michael Langemeier - Purdue University
Metrics that can be used to measure farm profitability include earnings before interest, taxes, and amortization (EBITA), net farm income, the operating profit margin ratio, return on assets, and return on equity (Langemeier, 2020).
Each of these measures has its advantages and disadvantages.
When focusing on whole-farm profitability, net farm income is typically used. When focusing on margins or rates of return and we want to include capital gains on assets in our financial performance metrics, return on assets and return on equity are typically used. This article examines trends in net farm income and return on assets and its components for the U.S. farm sector.
Net farm income is used to cover owner withdrawals (e.g., family living expenditures), to make principal payments on noncurrent debt, and to replace or purchase assets. Net farm income does not include capital gains on land.
Increases in net worth, on the other hand, can be due to retained earnings (i.e., the portion of net farm income retained in the business) and/or capital gains on land. Because owned land is such an important asset on farm balance sheets (Langemeier, 2022), over time, the portion of earnings coming from capital gains on land is not trivial. Thus, there are two important sources of income: current income and capital gains.
Current income is represented by rental payments (e.g., share rent, cash rent) for non-operator landlords and by the net return to land for farm operators. Capital gains (losses) represent annual increases (decreases) in land values.
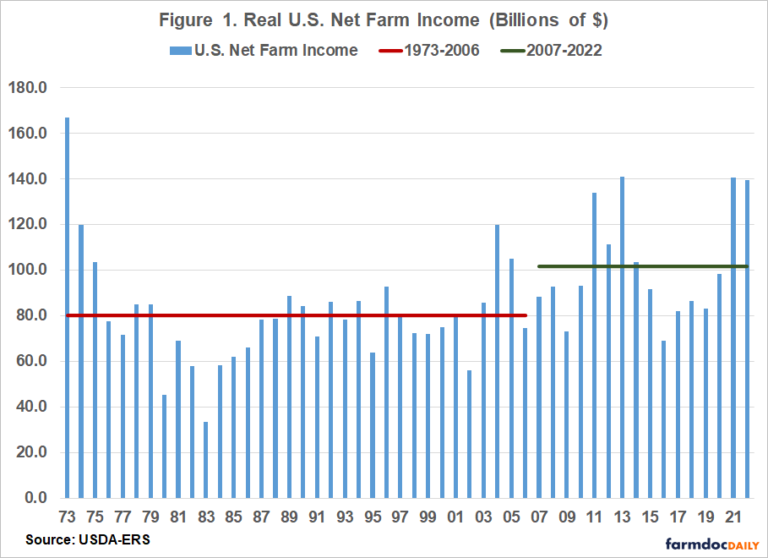
Data in this article were obtained from information reported by USDA-ERS, which includes both net farm income and rates of return. Figure 1 illustrates U.S. real net farm income (in 2021 $) from 1973 to 2022. The estimate for 2022 was made in early September so it represents a projected or forecasted value.
Long-run averages for the 1973 to 2006, and the 2007 to 2022 periods are also presented in Figure 1. The average real U.S. net farm income for the 1973 to 2006 period was $80.3 billion, while the average for the 2007 to 2022 period was $101.7 billion. From 2014 to 2020, U.S. real net farm income was below the average since 2007.
The values for 2021 and 2022 are well above the long-run averages, and compare favorably with the high net farm incomes experienced from 2011 to 2013. To better gauge the relative strength of net farm incomes in 2021 to 2022, Figure 2 presents real U.S. net farm income as well as net farm income plus or minus one standard deviation.
Years for which net farm income was one standard deviation or above the average net farm income from 1973 to 2022 (i.e., $87.1 billion) were as follows: 1973, 1974, 2004, 2011, 2013, 2021, and 2022. Notice that the 2021 and 2002 values are included in the list. Having said that, it is important to note that the net farm income for 2022 is a forecast.
To read the entire article, click here.