Lee Schulz, ISU Extension Livestock Economist | Oct 10, 2022
Are packers rethinking plans when it comes to expansion?
During 2020, 2021, and 2022 there have been several publicly announced plans for beef packing capacity additions. New plants and expansions of existing plants would add up to 20,000 head of daily capacity according to reports.
Planning and follow through for projects of this size take a lot of time. Some projects have broken ground. Some additions have been paused indefinitely. Others that are still in the works have changed timelines. Some additions may not come to fruition. New projects not currently on the list may materialize.
Some existing plants could cease production. The least efficient plants would likely be the most vulnerable.
Why packers may be rethinking plans
Building material prices have risen 37 percent when comparing August 2022 to 2020. Packing plant investors have no control over interest rates. Rising interest rates boost cash needed to service debt, which can have a large financial impact on an investment’s ability to cash flow.
The current labor market is extremely tight. Nationwide, two job openings are available for each unemployed individual. Employers having difficulty filling open positions is not favorable for launching expansions.
Beef cow numbers began declining in 2019. If the last cattle cycle is any indication it could be another several years before the cattle inventory turns.
Volume sweet spots vary
Minimum efficient scale is the volume at which a plant achieves lowest average total cost per head slaughtered. Research suggests beef processing costs per head bottom somewhere beyond one million head per year. In 2021, the United States had 12 plants of this size (Table 1). Since 1993 the United States has consistently had between 12 and 16 of these size plants. Doing the math, these plants on average slaughter about 5,000 head per day.
Medium-sized plants, in the 1,000 head to 2,000 head per day range, can usually better achieve some level of specialization in specific products, brands and types of cattle, which can help offset lower efficiencies relative to the largest plants. Small and very small plants have an important role in even further specialization and direct-to-consumer marketing. While large in number, these small plants process a very small proportion of the FI cattle slaughter.
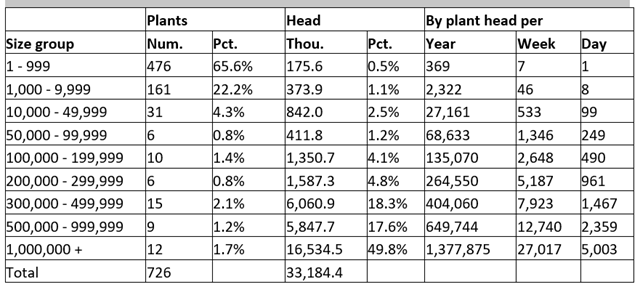
Table 1. U.S. Federally Inspected Cattle Plants and Head Slaughtered by Size Group, 2021
Data source: USDA-NASS.
Notes: By plant head per year calculations are simple averages of the total head slaughtered per year divided by the number of plants by size group. By plant head per week and per day calculations assume 51 slaughter weeks per year and 5.4 slaughter days per week.
Utilization is cyclical
Capacity utilization is the percentage of operational capacity that is being used. Calculating a utilization-to-capacity ratio gives insight on how the beef packing industry is producing relative to operational capacity. A ratio can be derived by dividing current monthly national FI steer and heifer slaughter volume by the maximum national FI steer and heifer slaughter volume that occurred for the same month over the prior three years, which serves as a “presumed” operational capacity. Capacity utilization can exceed 100%. Increasing Saturday slaughter could result in such a situation. This does not mean the industry exceeded its physical capacity.
Packing capacity utilization rate parallels the cattle cycle. In 2014 and 2015 relatively low cattle inventories coincided with a bottom in the utilization rate at about 85% of operational capacity (Figure 1). Utilization then notably rose during the latter part of the decade, as cattle supplies grew, fluctuating at around 100%–105% leading into 2020. Fed cattle slaughter capacity utilization rate tallied 102.5% in August 2022.
Historically, fed cattle prices tended to ease when packers were operating at or near processing capacity. For instance, since 1986 a negative correlation has existed between estimated capacity utilization and the price of live steers and heifers. That is, higher utilization, lower prices.
Shackle space doesn’t necessarily need to be add for the capacity utilization formula to work in producers’ favor. The numerator in the formula is cattle slaughter volume. Total fed cattle slaughter thus far in 2022 is up 0.8% as the 1.6% dip in steer slaughter is offset by a 4.8% rise in heifer slaughter. Fourth quarter 2022 cattle slaughter will be lower than last year. Cattle slaughter is projected to decrease sharply in 2023 and again in 2024.

Source: Iowa State University