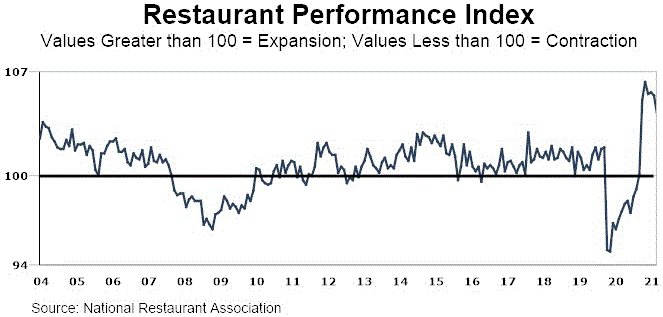
The National Restaurant Association’s Restaurant Performance Index (RPI) fell to a 6-month low in August, as several indicators retreated from their elevated pandemic-disrupted levels. The RPI – a monthly composite index that tracks the health of the U.S. restaurant industry – stood at 104.2 in August, down 1.1% from a level of 105.4 in July.
Although sales and customer traffic levels remain higher than their dampened 2020 readings, restaurant operators are not as optimistic that business conditions will continue to improve in the months ahead.
The Current Situation Index, which measures current trends in four industry indicators, stood at 104.7 in August – down 1.5% from July and the lowest reading since March. Although the sales, traffic and labor indicators were somewhat softer than recent months, they remained elevated in historical terms due to the dampened early-pandemic comparisons. As result, the Current Situation Index is still not a direct reflection of the overall health of the restaurant industry.
The Expectations Index, which measures restaurant operators’ six-month outlook for four industry indicators, stood at 103.7 – the lowest level in seven months. Restaurant operators’ outlook for sales growth and the economy is somewhat dampened from recent months, but a solid majority of operators continue to plan for capital expenditures.
RPI Methodology
The National Restaurant Association's Restaurant Performance Index (RPI) is a monthly composite index that tracks the health of the U.S. restaurant industry. Launched in 2002, the RPI is released on the last business day of each month.
The RPI is measured in relation to a neutral level of 100. Index values above 100 indicate that key industry indicators are in a period of expansion, while index values below 100 represent a period of contraction for key industry indicators. The Index consists of two components — the Current Situation Index, which measures current trends in four industry indicators (same-store sales, traffic, labor and capital expenditures), and the Expectations Index, which measures restaurant operators’ six-month outlook for four industry indicators (same-store sales, employees, capital expenditures and business conditions).
The RPI is based on the responses to the National Restaurant Association’s Restaurant Industry Tracking Survey, which is fielded monthly among restaurant operators nationwide on a variety of indicators including sales, traffic, labor and capital expenditures.


